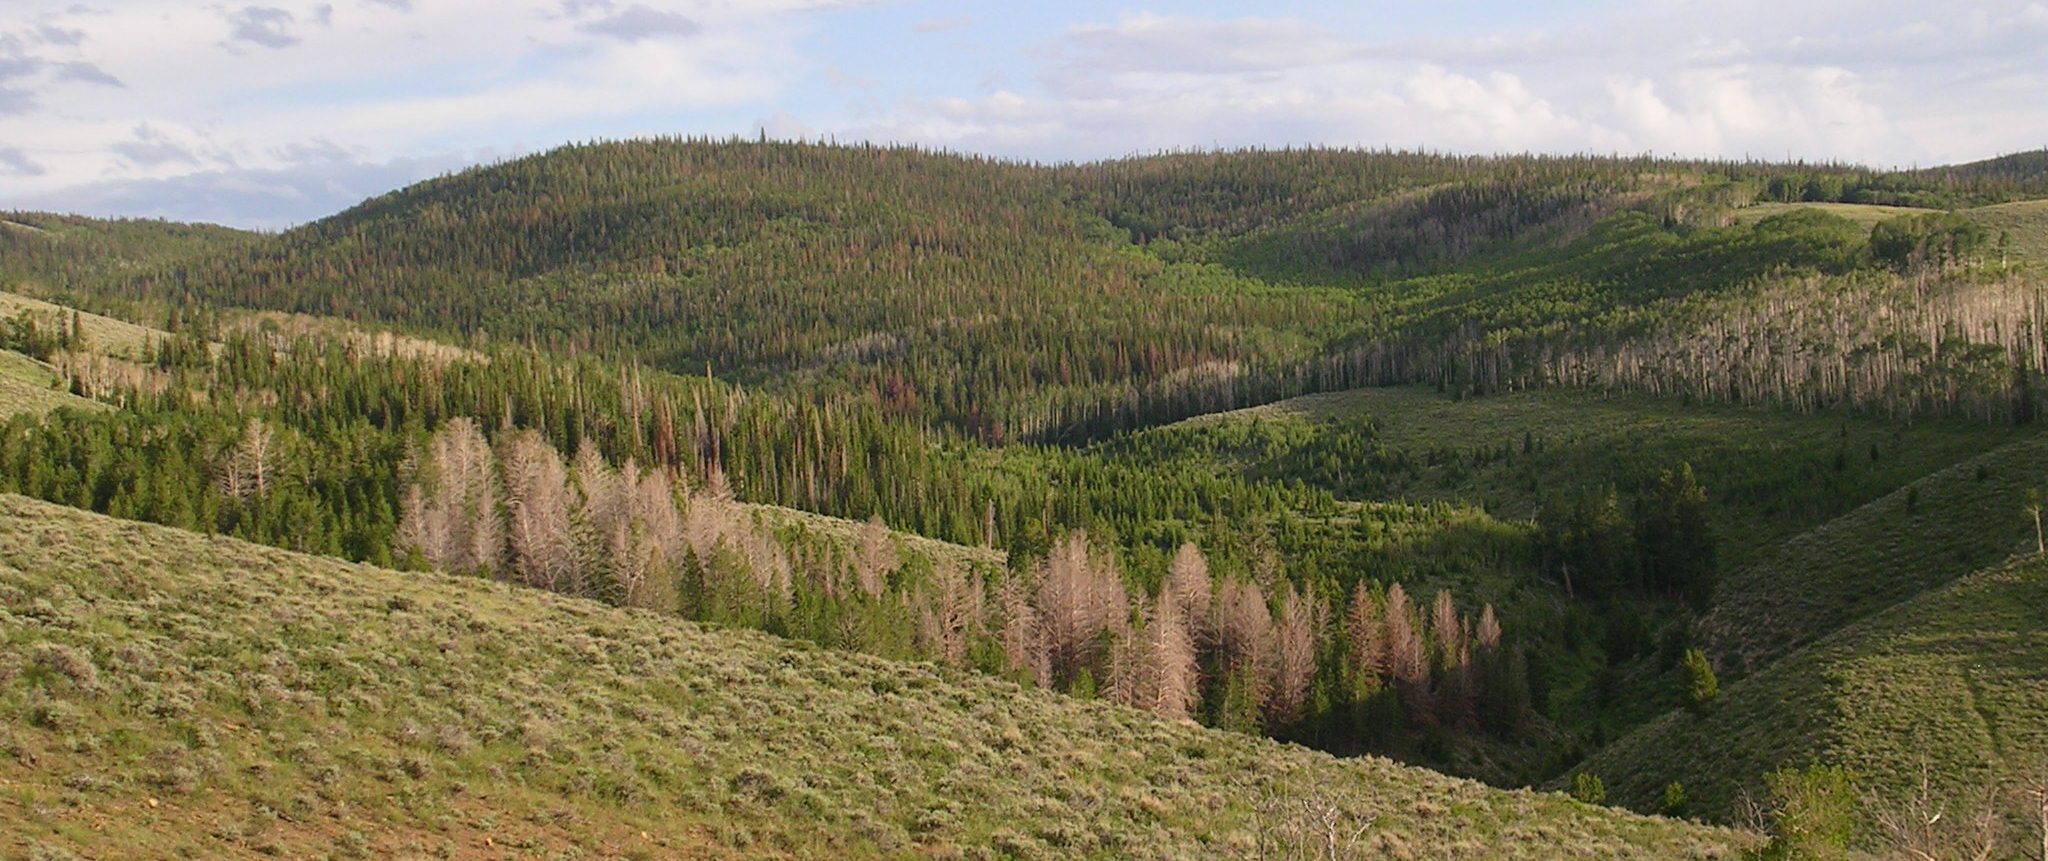
We recently published a paper in the journal Remote Sensing Letters, on mapping forest functional type in a forest-shrubland ecotone. Our study area is located in the southern portion of the Wyoming Basin Ecoregion centered on several prominent forested ridges surrounded by shrubland. Although the forests are extensive in some areas, they are characterized by small, isolated patches that act as islands in a sea of sagebrush. The forest-shrubland ecotone (or transition area) provides habitat for many different species and therefore it is important to have accurate data on the type, size and extent of forest type.
However, in heterogeneous ecosystems such as the one, regional and national land cover mapping products typically lack the spatial resolution needed to adequately characterize the extent and juxtaposition of land cover. We present a framework that incorporates aerial photos, satellite imagery and topographic information to model dominant forest cover at local scales across a forest-shrubland ecotone.


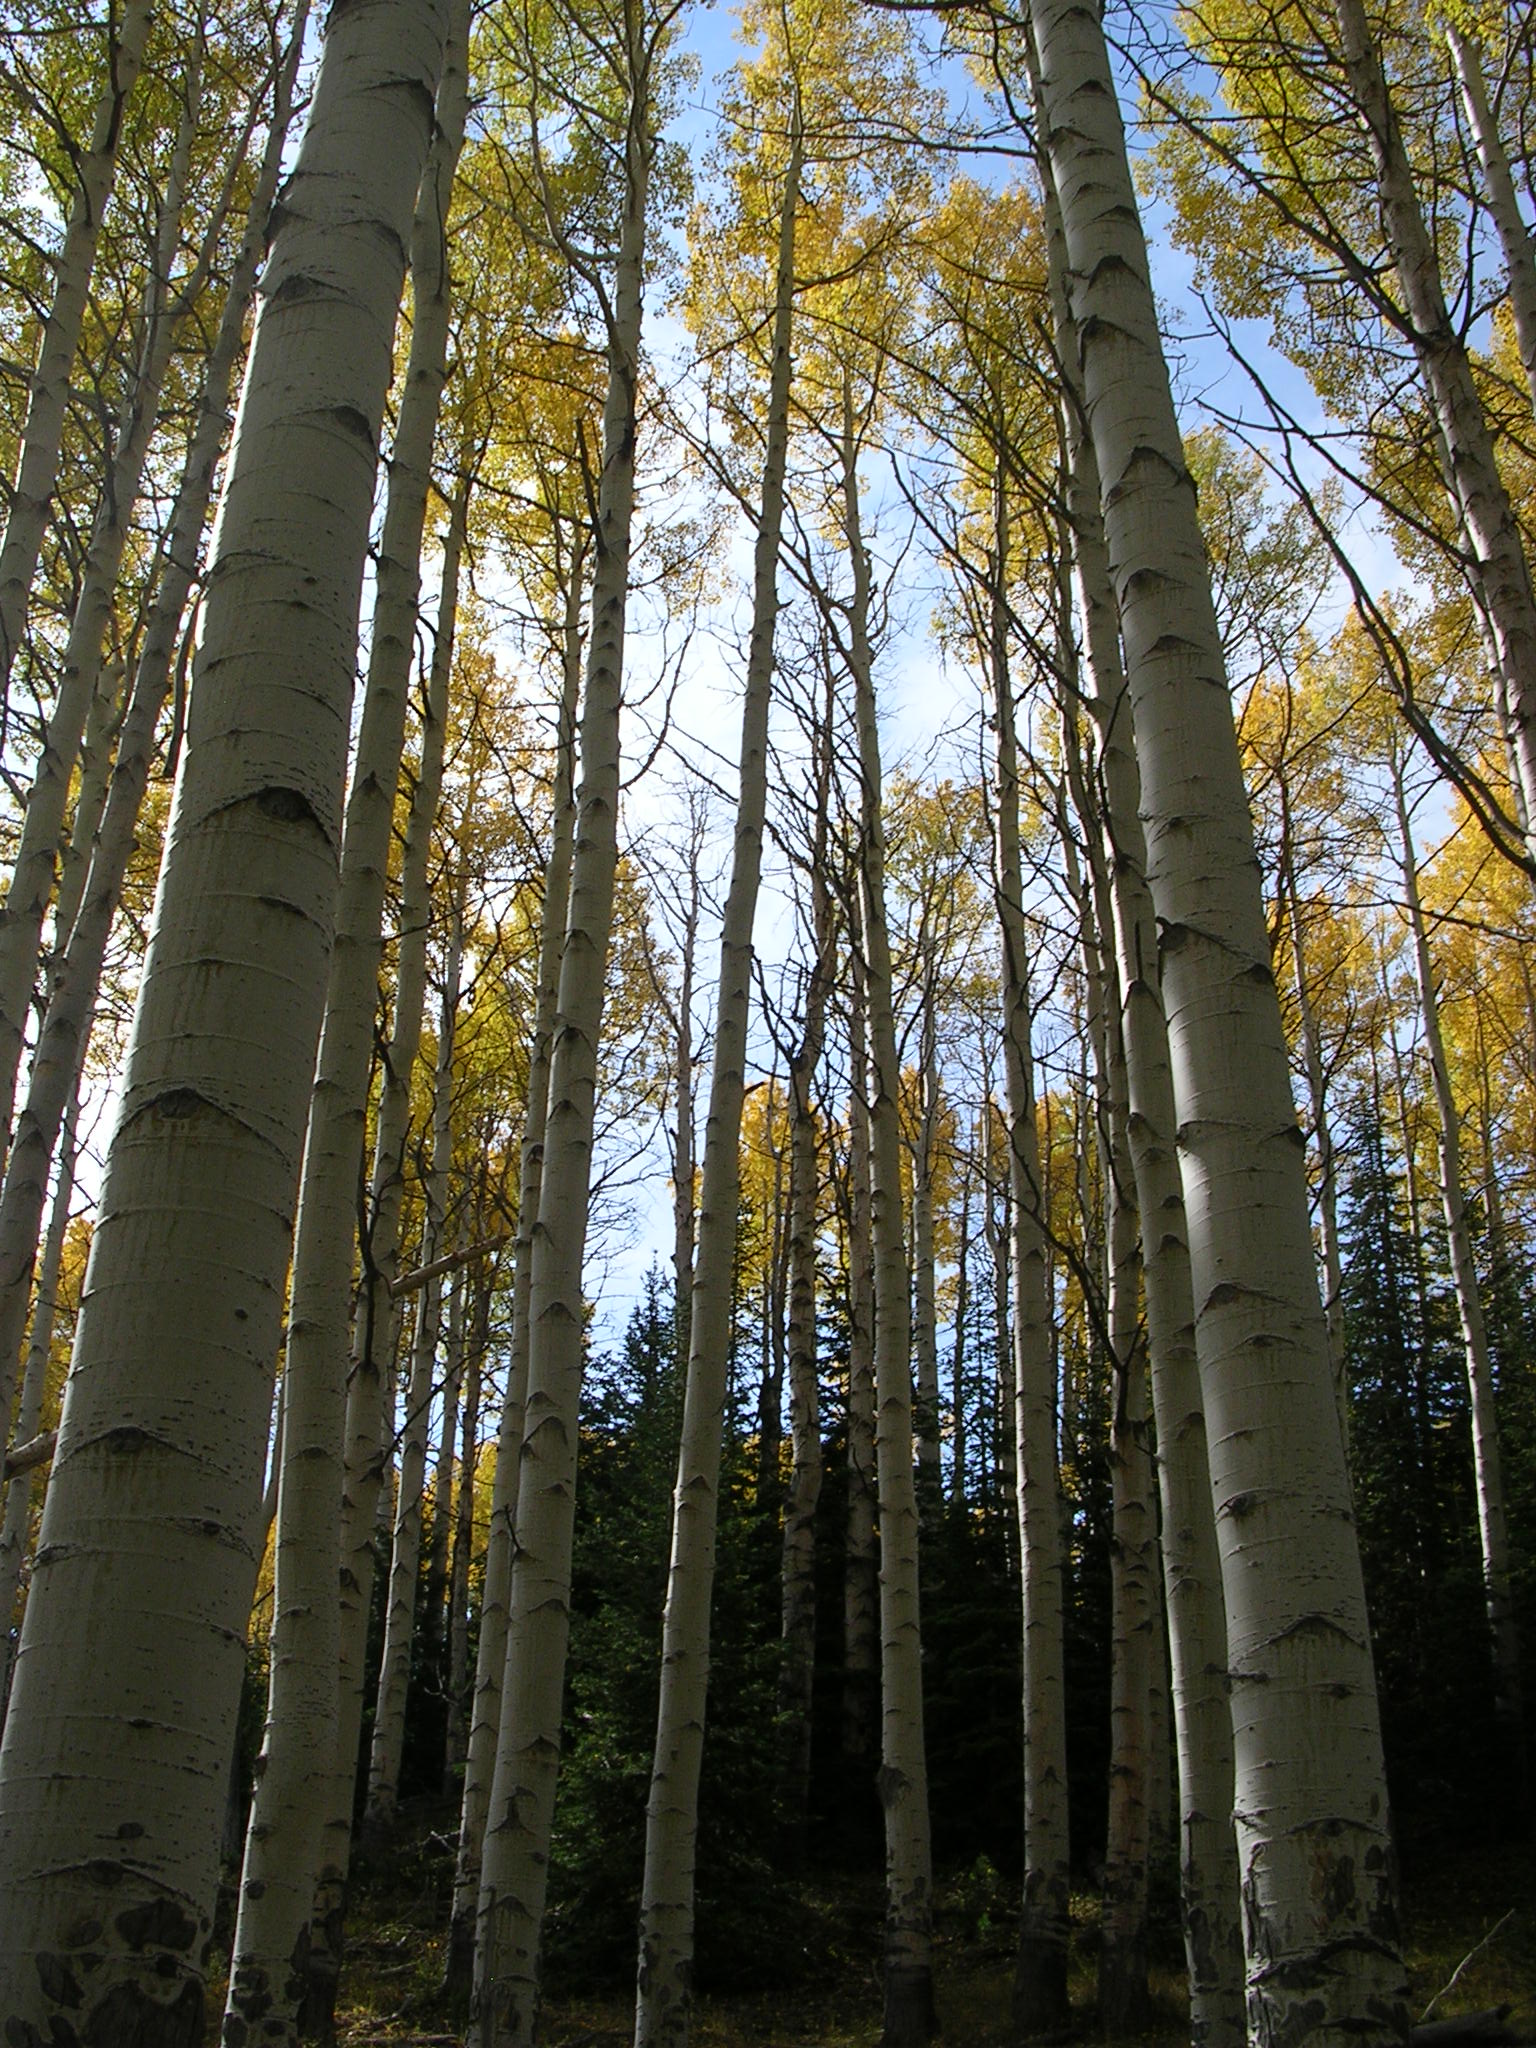
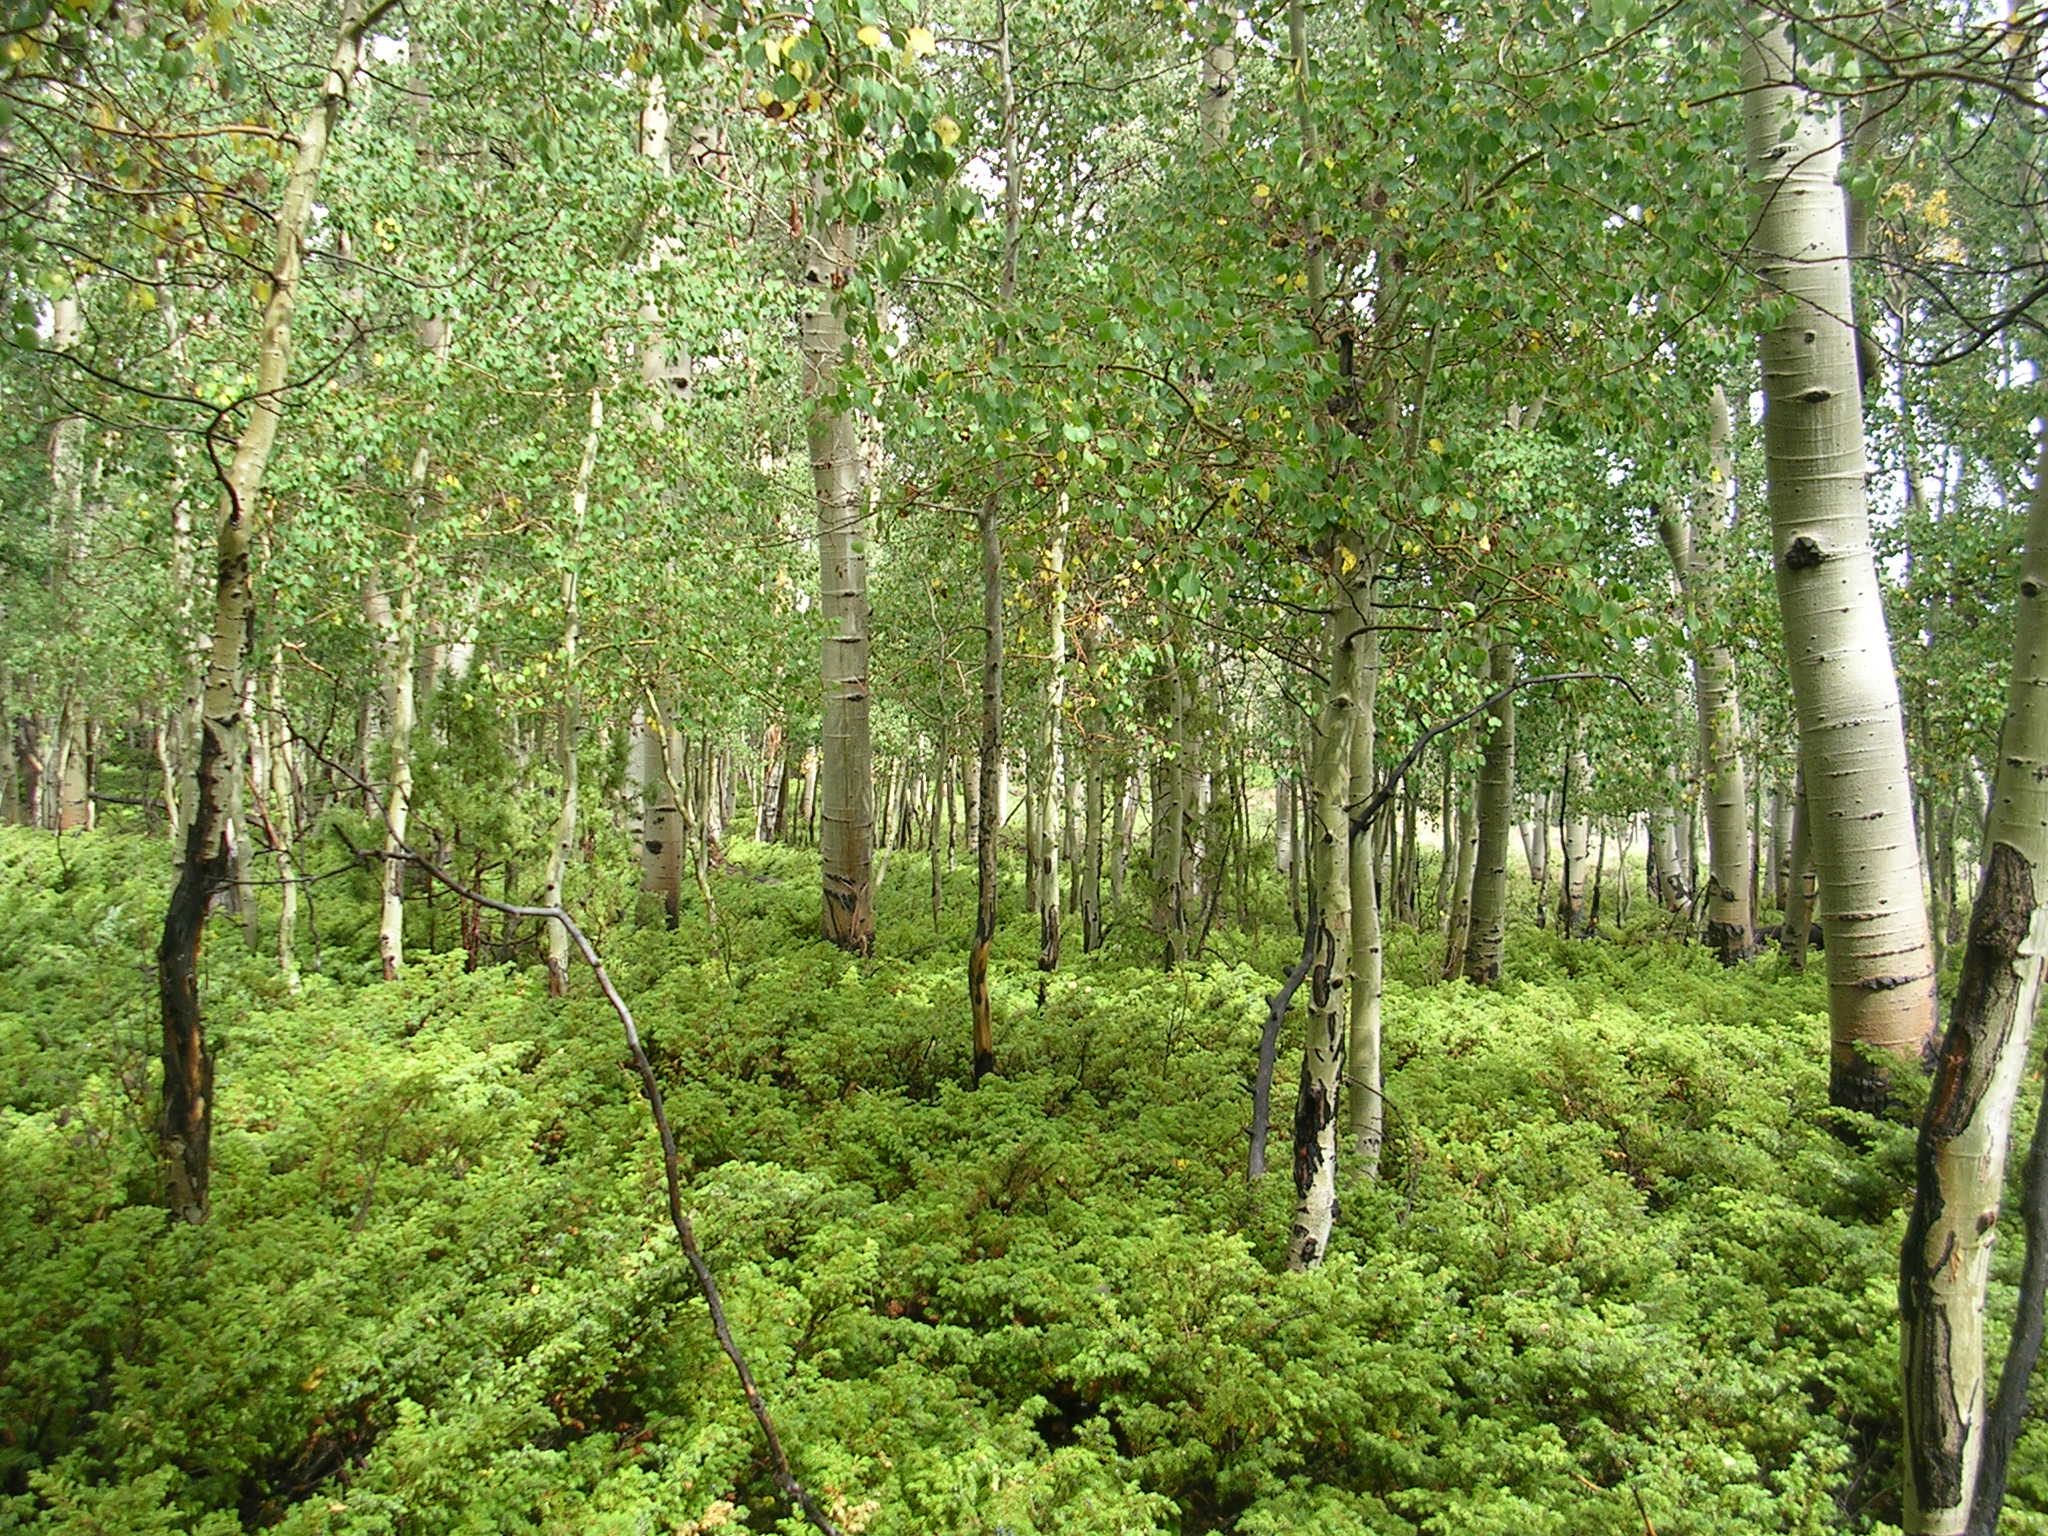
The driving concept of the analysis was to exploit phenological differences in forest cover type by “viewing” the forest at different times of the year. Phenology is the study of the timing of specific biological events, such as plant flowering, animal migration, reproduction, etc. The phenological event of interest in our study is leaf drop by deciduous trees in autumn. Simply put, deciduous forests look different to our eyes (and satellites) in the summer than they do once the leaves turn color and fall off in autumn. Deciduous forest and coniferous forest look slightly different during the summer, but they look very different after deciduous leaves fall to the ground. In our study area, the iconic Quaking aspen tree is the sole deciduous forest type. Satellites can differentiate between vegetation types based on the amount of radiation that is absorbed or reflected which is different when there are leaves on the trees compared to when the leaves are off the trees. In our study we interpreted forest cover type in aerial photos and used this to “scale-up” the information to satellite imagery. We developed probability of occurrence models for both deciduous and coniferous forest, and then combined the model outputs into a synthesis map depicting forest cover type.

The output of this project provides valuable information that we used in subsequent research to assess the effects of drought on forest community type in this semi-arid region (Assal et al. 2016). The results from our analysis are suitable to characterize the extent and juxtaposition of forest cover in a highly heterogeneous ecosystem (see below). The input data we used in the models has a resolution of 10 meters and the output synthesis map has an overall classification accuracy of 87%. This approach enabled us to capture the extent and pattern of broad forest and very small and isolated patches that are missed by regional land cover data. Furthermore our framework utilizes open access aerial photos (source: National Agriculture Imagery Program) and satellite data (source: SPOT5 – North America Data Buy). In this way, it is transferable to other highly heterogeneous ecosystems to develop critical baseline tree cover data that can be updated at regular intervals to monitor the effects of disturbance and long-term ecosystem dynamics. Finally, our analysis addressed spatial autocorrelation in species distribution models (SDMs). Spatial autocorrelation is often ignored in SDMs and there is not a lot of literature on how to test for it in logistic regression models. It is my hope that this paper provides information on both aspects of spatial autocorrelation.


Literature Cited: Literature Cited
- Assal, T.J., Anderson, P.J., Sibold, J., 2016. Spatial and Temporal Trends of Drought Effects in a Heterogeneous Semi-Arid Forest Ecosystem. Forest Ecology and Management. 365, 137-151.
- Assal, T.J., Anderson, P., Sibold, J., 2015. Mapping forest functional type in a forest-shrubland ecotone using SPOT imagery and predictive habitat distribution modelling. Remote Sensing Letters. 6, 755–764.
Top image: A small patch of forest on Little Mountain, Wyoming.
