Google Earth Engine (GEE) is a cloud-based platform for planetary-scale environmental data analysis which uses a JavaScript API and an online IDE code editor. In short, you can utilize remotely sensed imagery available in Google’s cloud to run analyses without downloading the data to your local machine. You’ll need to sign up as a developer to gain access here.
Below is an example from an upcoming lecture to the Anthropology and Geography group of the Social Sciences Department at Cal Poly University. In my talk I showed an example of the Normalized Difference Vegetation Index for Cal Poly’s campus. Here I’ll demonstrate the workflow I used to create NDVI using GEE with data from the cloud.
To execute the example below, please download the campus shapefile here (originally obtained from the campus website). You’ll need to upload the shapefile into GEE using these instructions (see the “Uploading table assets” section) and load the data into your script using these instructions (see the “Importing assets to your script” section). If you’d like to run the example without downloading campus data, skip to the second code block below.
Copy and paste the following code into the Code Editor of GEE:
// Load four 2016 NAIP quarter quads, different locations.
var naip2016 = ee.ImageCollection('USDA/NAIP/DOQQ')
.filterBounds(ee.Geometry.Rectangle(-120.73857, 35.36587, -120.61841, 35.25408))
.filterDate('2016-01-01', '2016-12-31');
// Spatially mosaic the images in the collection and display.
var mosaic = naip2016.mosaic();
// Get information about the bands as a list; prints in console at right
var bandNames = mosaic.bandNames();
print('Band names: ', bandNames);
//Get the projection of Band 1
var b1proj = mosaic.select('B').projection();
print ('Band 1 projection: ', b1proj);
//set map center to Baker Lawn on CP's campus
Map.setCenter(-120.65995, 35.9103, 12);
//display natural color
Map.addLayer(mosaic, {bands: ['R', 'G', 'B']}, 'NAIP DOQQ');
//display false color IR
//Map.addLayer(mosaic, {bands: ['N', 'R', 'G']}, 'NAIP DOQQ');
// Caculate NDVI.
var ndvi = mosaic.normalizedDifference(['N', 'R']);
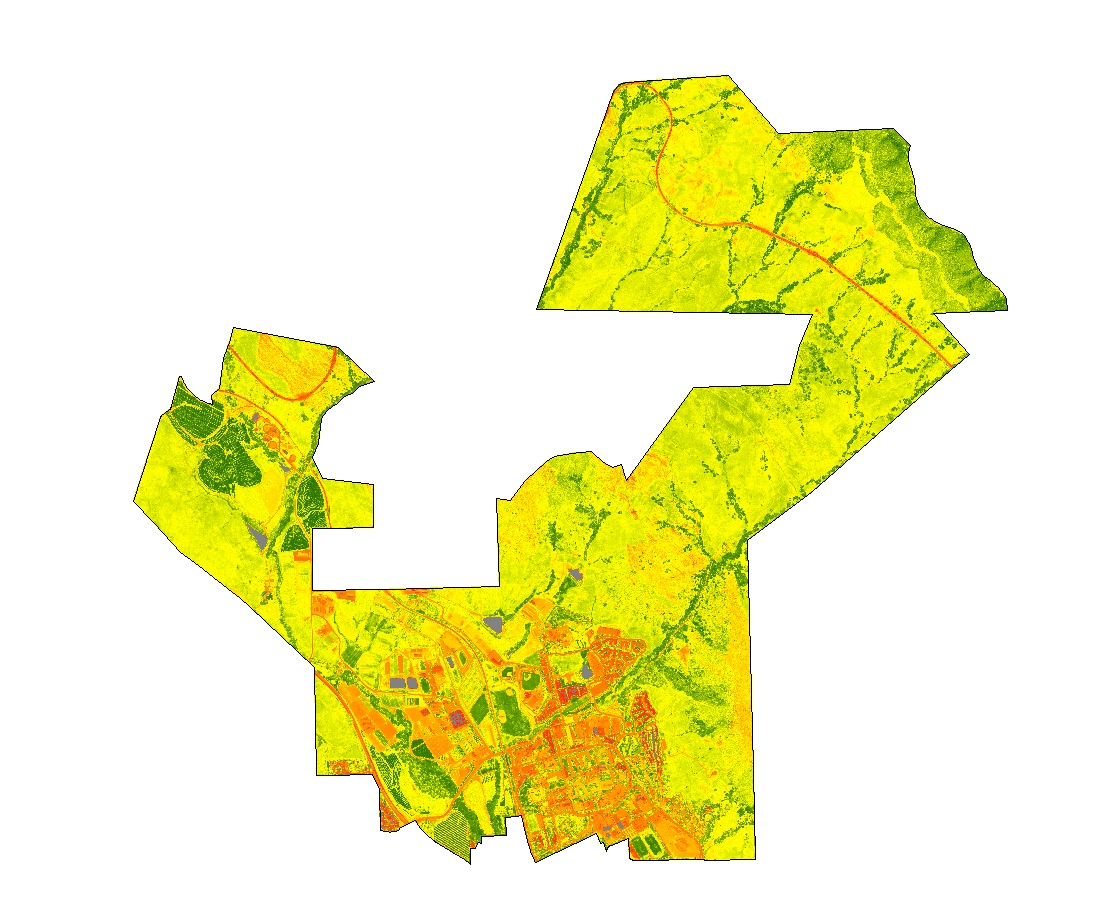
// Display the result using a color ramp: dark red, red, orange, yellow, lime, green, dark green
var ndviParams = {min: -1, max: 1, palette: ['8B0000','FF0000', 'FF4500', 'FFFF00', '00FF00','008000', '006400']};
// Clip NDVI to campus boundary and add to map
Map.setCenter(-120.65995, 35.31203, 13);
Map.addLayer(ndvi.clip(table), ndviParams);
//Display the outline of campus as a black line, no fill
// Create an empty image into which to paint the features, cast to byte.
var empty = ee.Image().byte();
// Paint all the polygon edges with the same number and width, display.
var outline = empty.paint({
featureCollection: table,
color: 1,
width: 1
});
Map.addLayer(outline, {palette: '000000'}, 'edges');
The code below does not require download of any campus data; however, it will calculate NDVI over the entire extent as opposed to the campus extent in the example above. Copy and paste the following code into the Code Editor of GEE:
// Load four 2016 NAIP quarter quads, different locations.
var naip2016 = ee.ImageCollection('USDA/NAIP/DOQQ')
  .filterBounds(ee.Geometry.Rectangle(-120.73857, 35.36587, -120.61841, 35.25408))
  .filterDate('2016-01-01', '2016-12-31');

// Spatially mosaic the images in the collection and display.
var mosaic = naip2016.mosaic();

// Get information about the bands as a list; prints in console at right
var bandNames = mosaic.bandNames();
print('Band names: ', bandNames);

//Get the projection of Band 1
var b1proj = mosaic.select('B').projection();
print ('Band 1 projection: ', b1proj);

//set map center to Baker Lawn on CP's campus
Map.setCenter(-120.65995, 35.9103, 12);
//display natural color
Map.addLayer(mosaic, {bands: ['R', 'G', 'B']}, 'NAIP DOQQ');
//display false color IR

// Caculate NDVI.
var ndvi = mosaic.normalizedDifference(['N', 'R']);

// Display the result using a color ramp: dark red, red, orange, yellow, lime, green, dark green
var ndviParams = {min: -1, max: 1, palette: ['8B0000','FF0000', 'FF4500', 'FFFF00', '00FF00','008000', '006400']};
//Map.addLayer(ndvi, ndviParams, 'NDVI image');

// Add NDVI to map
Map.setCenter(-120.65995, 35.31203, 13);
Map.addLayer(ndvi, ndviParams);
Top image: Cal Poly campus, San Luis Obispo, CA.