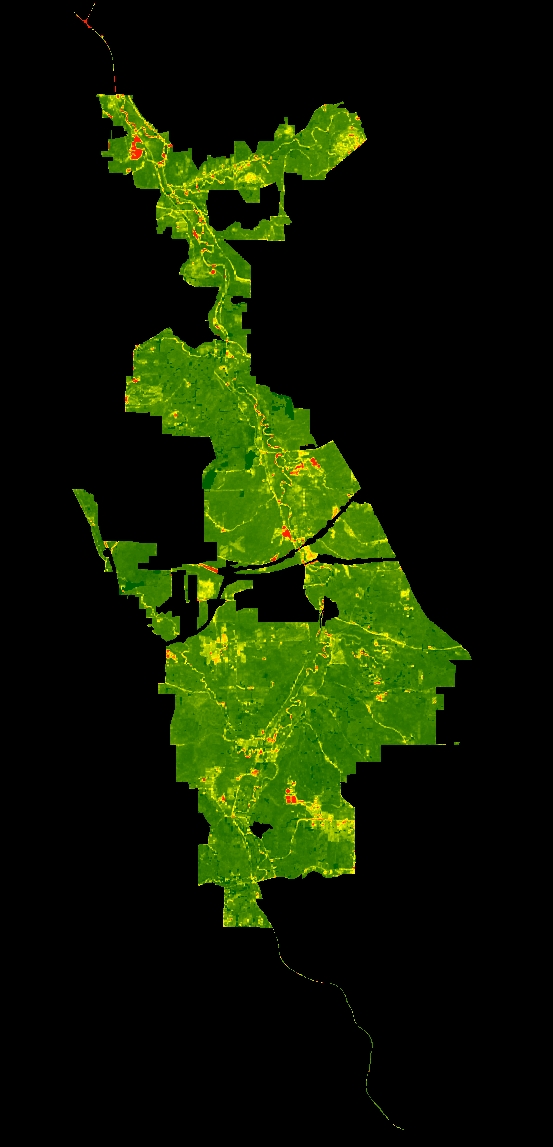
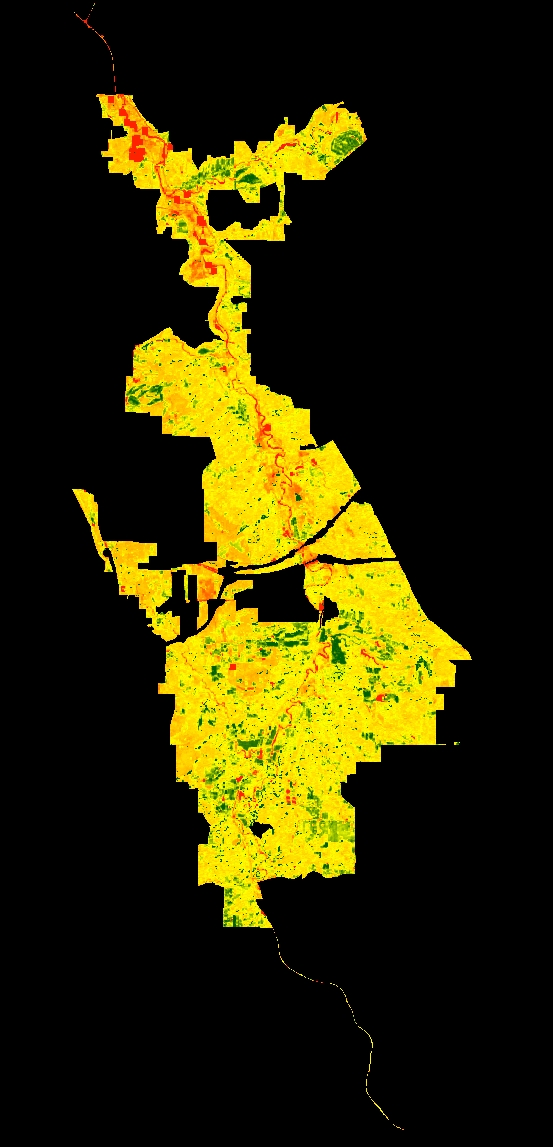
Below is an example from an upcoming lecture that I will be giving to the Department of Geography at Kent State University. In my talk I’ll show an example which compares plant productivity during the leaf-on and leaf-off seasons for nearby Cuyahoga Valley National Park. Below I’ll demonstrate the workflow I used to create NDVI using Google Earth Engine with data from the cloud. Thanks to geohackweek for some pointers on code.
Google Earth Engine (GEE) is a cloud-based platform for planetary-scale environmental data analysis which uses a JavaScript API and an online IDE code editor. In short, you can utilize remotely sensed imagery available in Google’s cloud to run analyses without downloading the data to your local machine. You’ll need to sign up as a developer to gain access here.
To execute the example below, please download the park shapefile here (Note, I’ve merged the shapefile into a single-part file as GEE doesn’t seem to be able to handle multi-part files very well). You’ll need to upload the shapefile into GEE using these instructions (see the “Uploading table assets” section) and load the data into your script using these instructions (see the “Importing assets to your script” section).
Copy and paste the following code into the Code Editor of GEE:
// load all Landsat 8 SR image within park boundary for a given season
var l8collection = ee.ImageCollection('LANDSAT/LC08/C01/T1_SR')
//var l8collection = ee.ImageCollection('LANDSAT/LC08/C01/T1_TOA')
          .filterBounds(ParkBound)
          .filterDate('2018-06-01', '2018-09-30'); //leaf on season (June 1 to Sept 30)
//          .filterDate('2017-11-15', '2018-03-01'); // leaf-off season Nov 15 to March 1

print(l8collection);

// Mask pixels with clouds and cloud shadows using the 'pixel_qa' band
// that is based on the cfmask for surface reflectance.
// https://landsat.usgs.gov/landsat-surface-reflectance-quality-assessment

// create function to mask clouds, cloud shadows, snow
var maskClouds = function(image){
  // make a new single band image from the pixel qa band
  var pixel_qa = image.select('pixel_qa');
  // retain clear (0) and water (1) pixels
  return image.updateMask(pixel_qa.eq(322));
};

// use "map" to apply the function to each image in the collection
var l8masked = l8collection.map(maskClouds);
print(l8masked);

// create function to add NDVI using NIR (B5) and the red band (B4)
var getNDVI = function(img){
  return img.addBands(img.normalizedDifference(['B5','B4']).rename('NDVI'));
};

// map over image collection
var l8ndvi = l8masked.map(getNDVI);

// for each pixel, select the "best" set of bands from available images
// based on the maximum NDVI/greenness
var composite = l8ndvi.qualityMosaic('NDVI').clip(ParkBound);

//set visualization parameters for NDVI
var ndviParams = {min: 0, max: 1, palette: ['red', 'yellow', 'green']};
Map.addLayer(composite.select('NDVI'), ndviParams, 'NDVI image');

//export image
// This will create a task in the 'tasks' tab
// launch from tasks tab to export image
Export.image.toDrive({
  image: composite.select('NDVI'),
  description: 'CVNP Leaf-on NDVI',
  //description: 'CVNP Leaf-off NDVI',
  scale:30 }); //meters
Top image: Changing seasons on Middle Mountain, Colorado, USA.