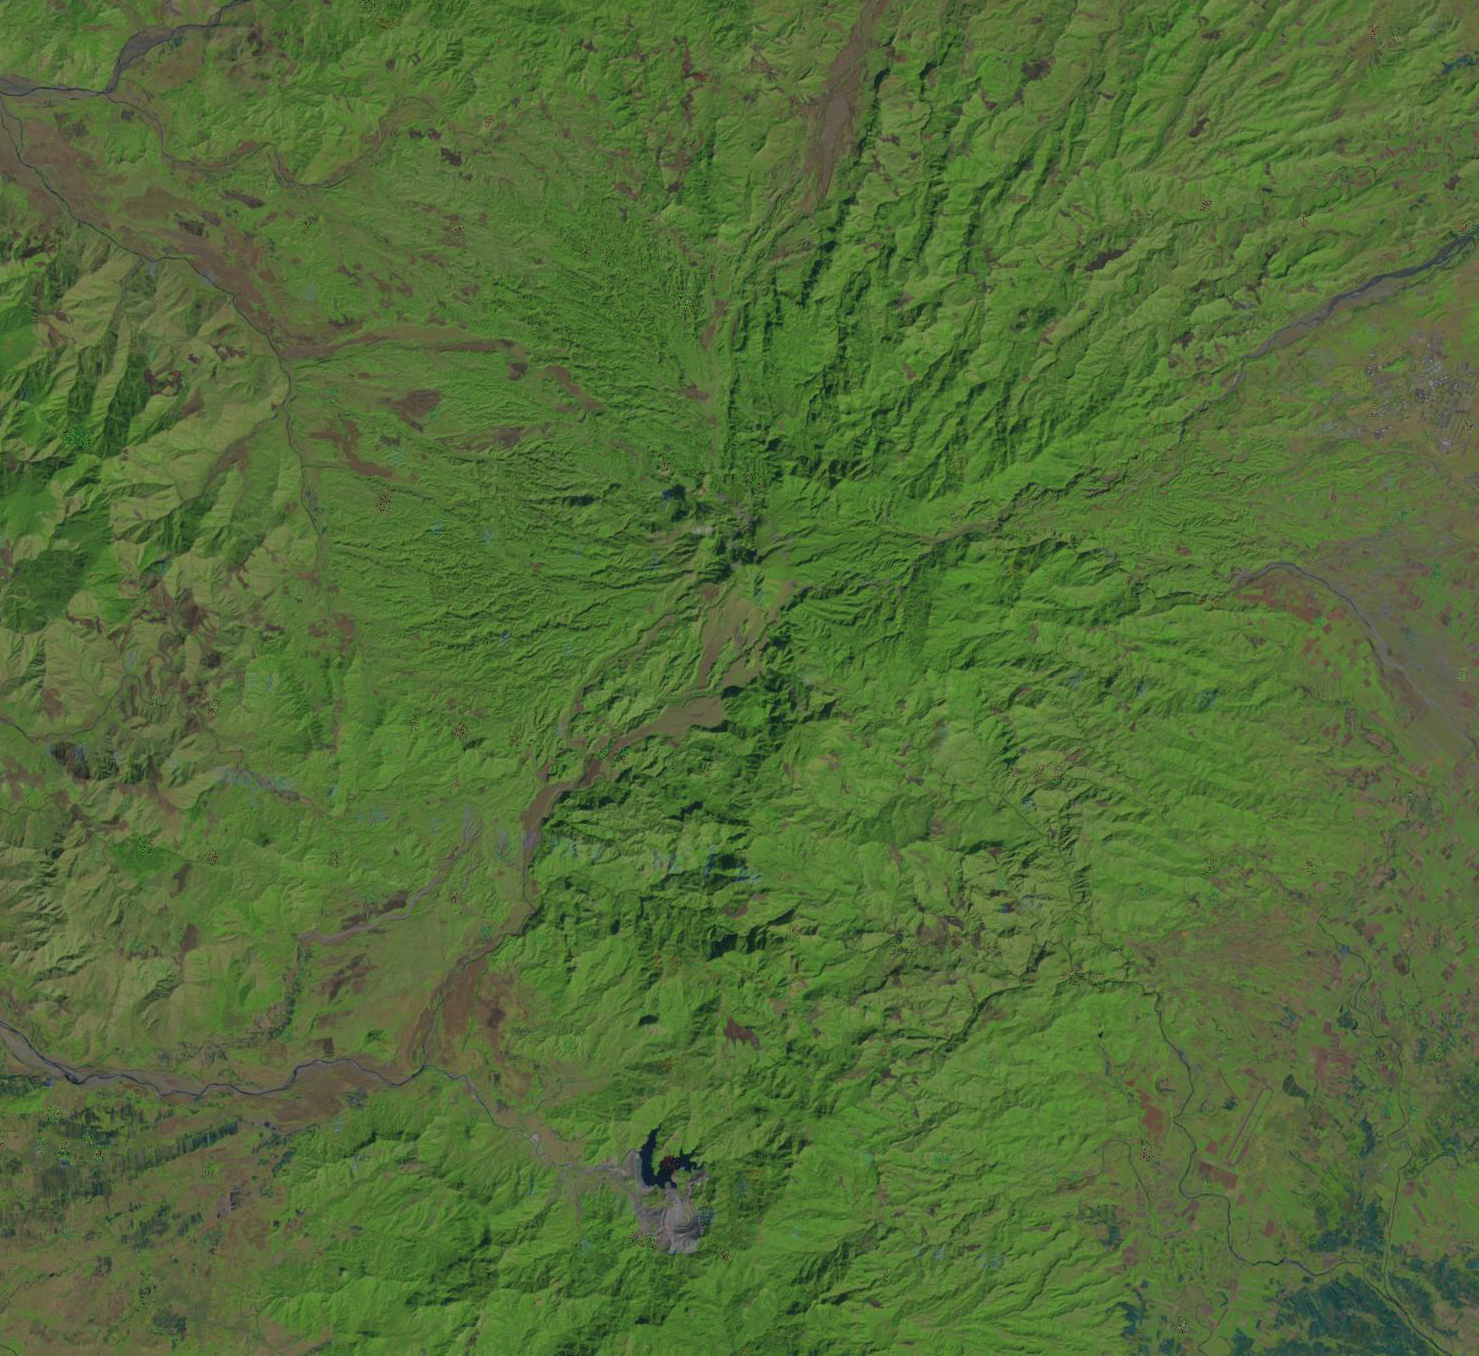
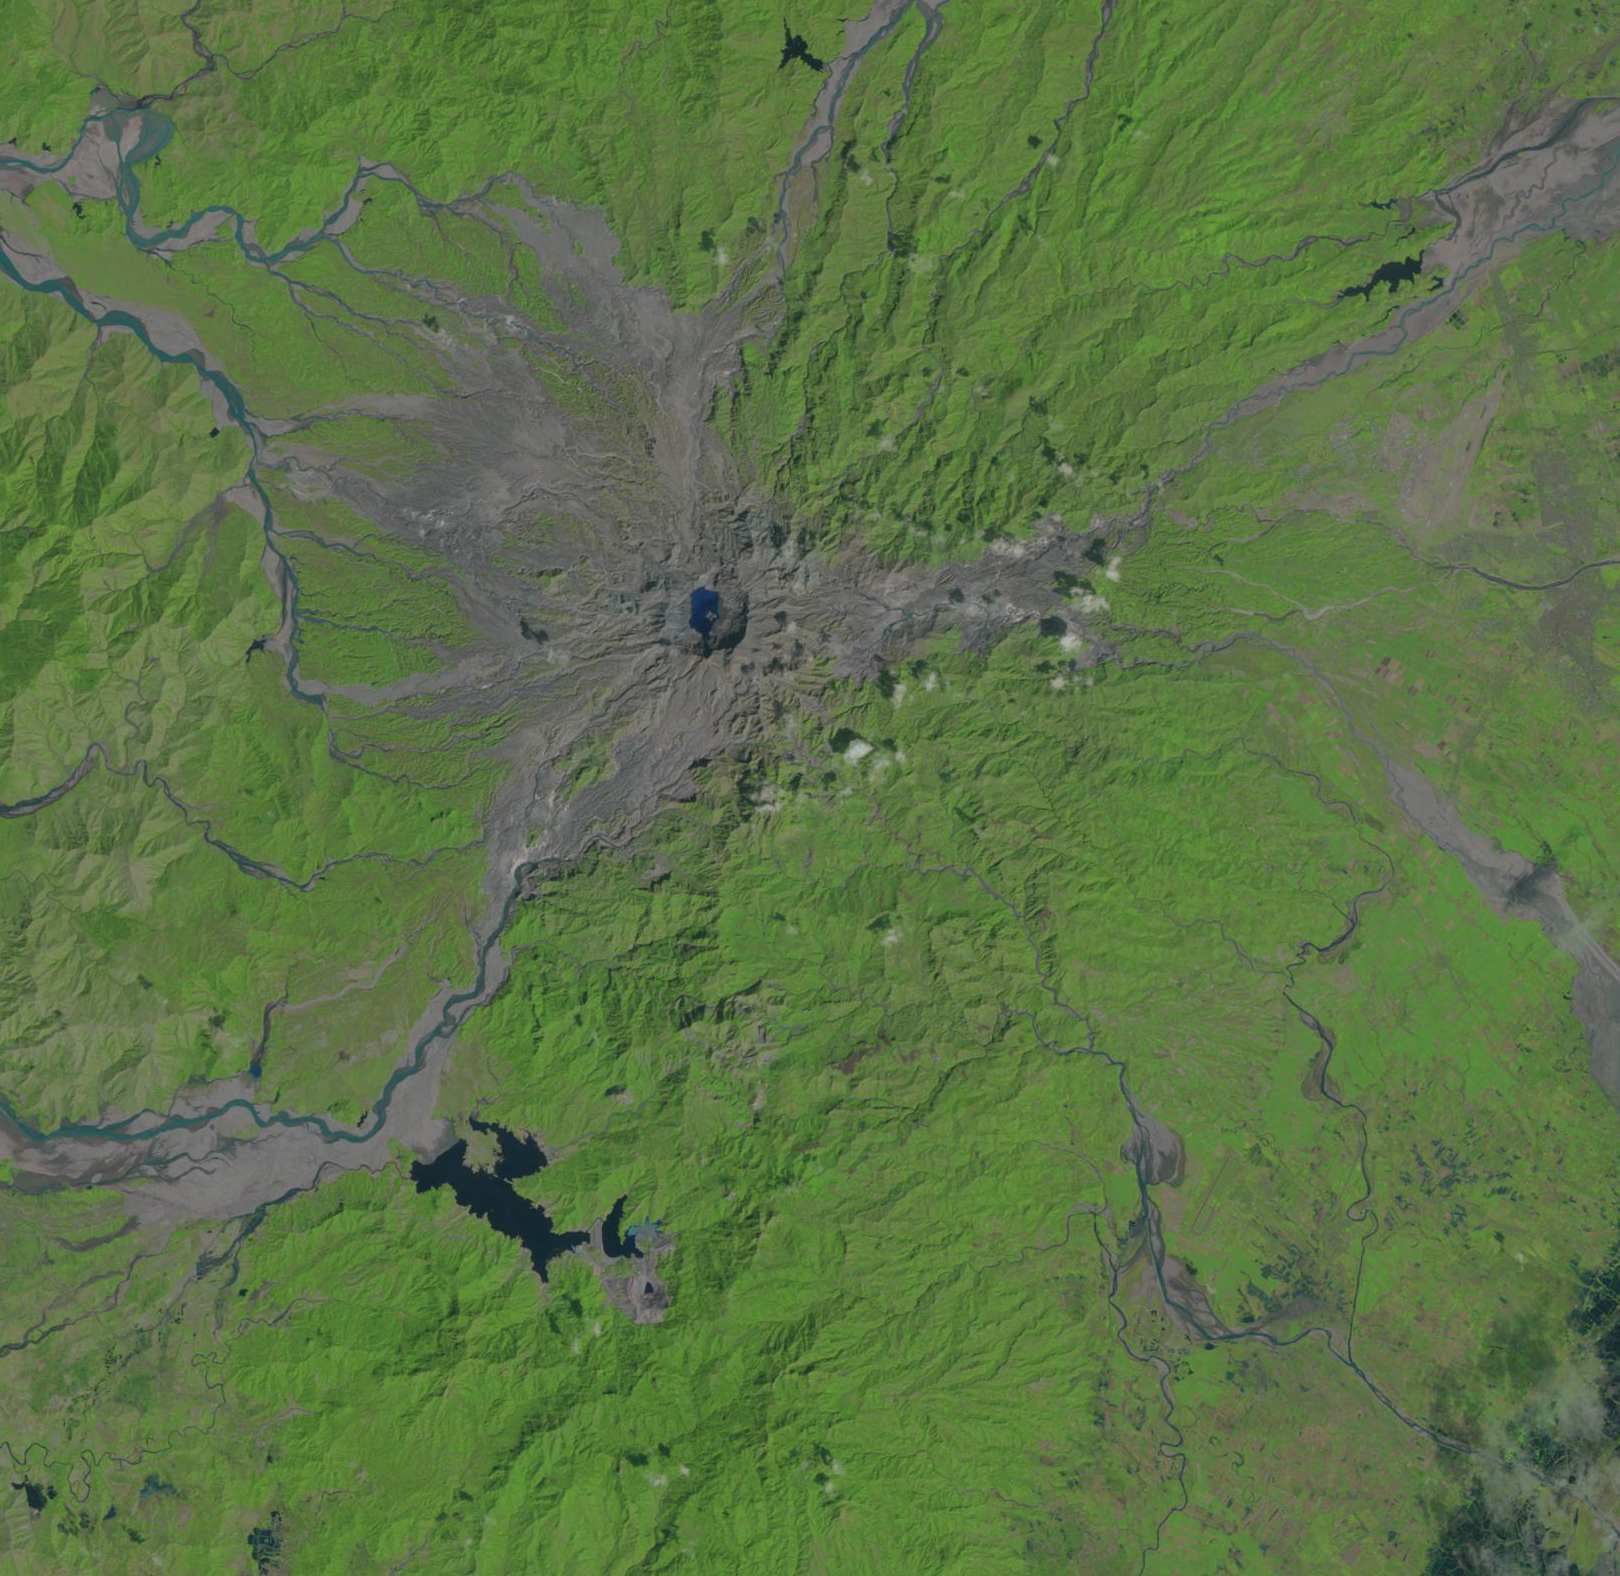
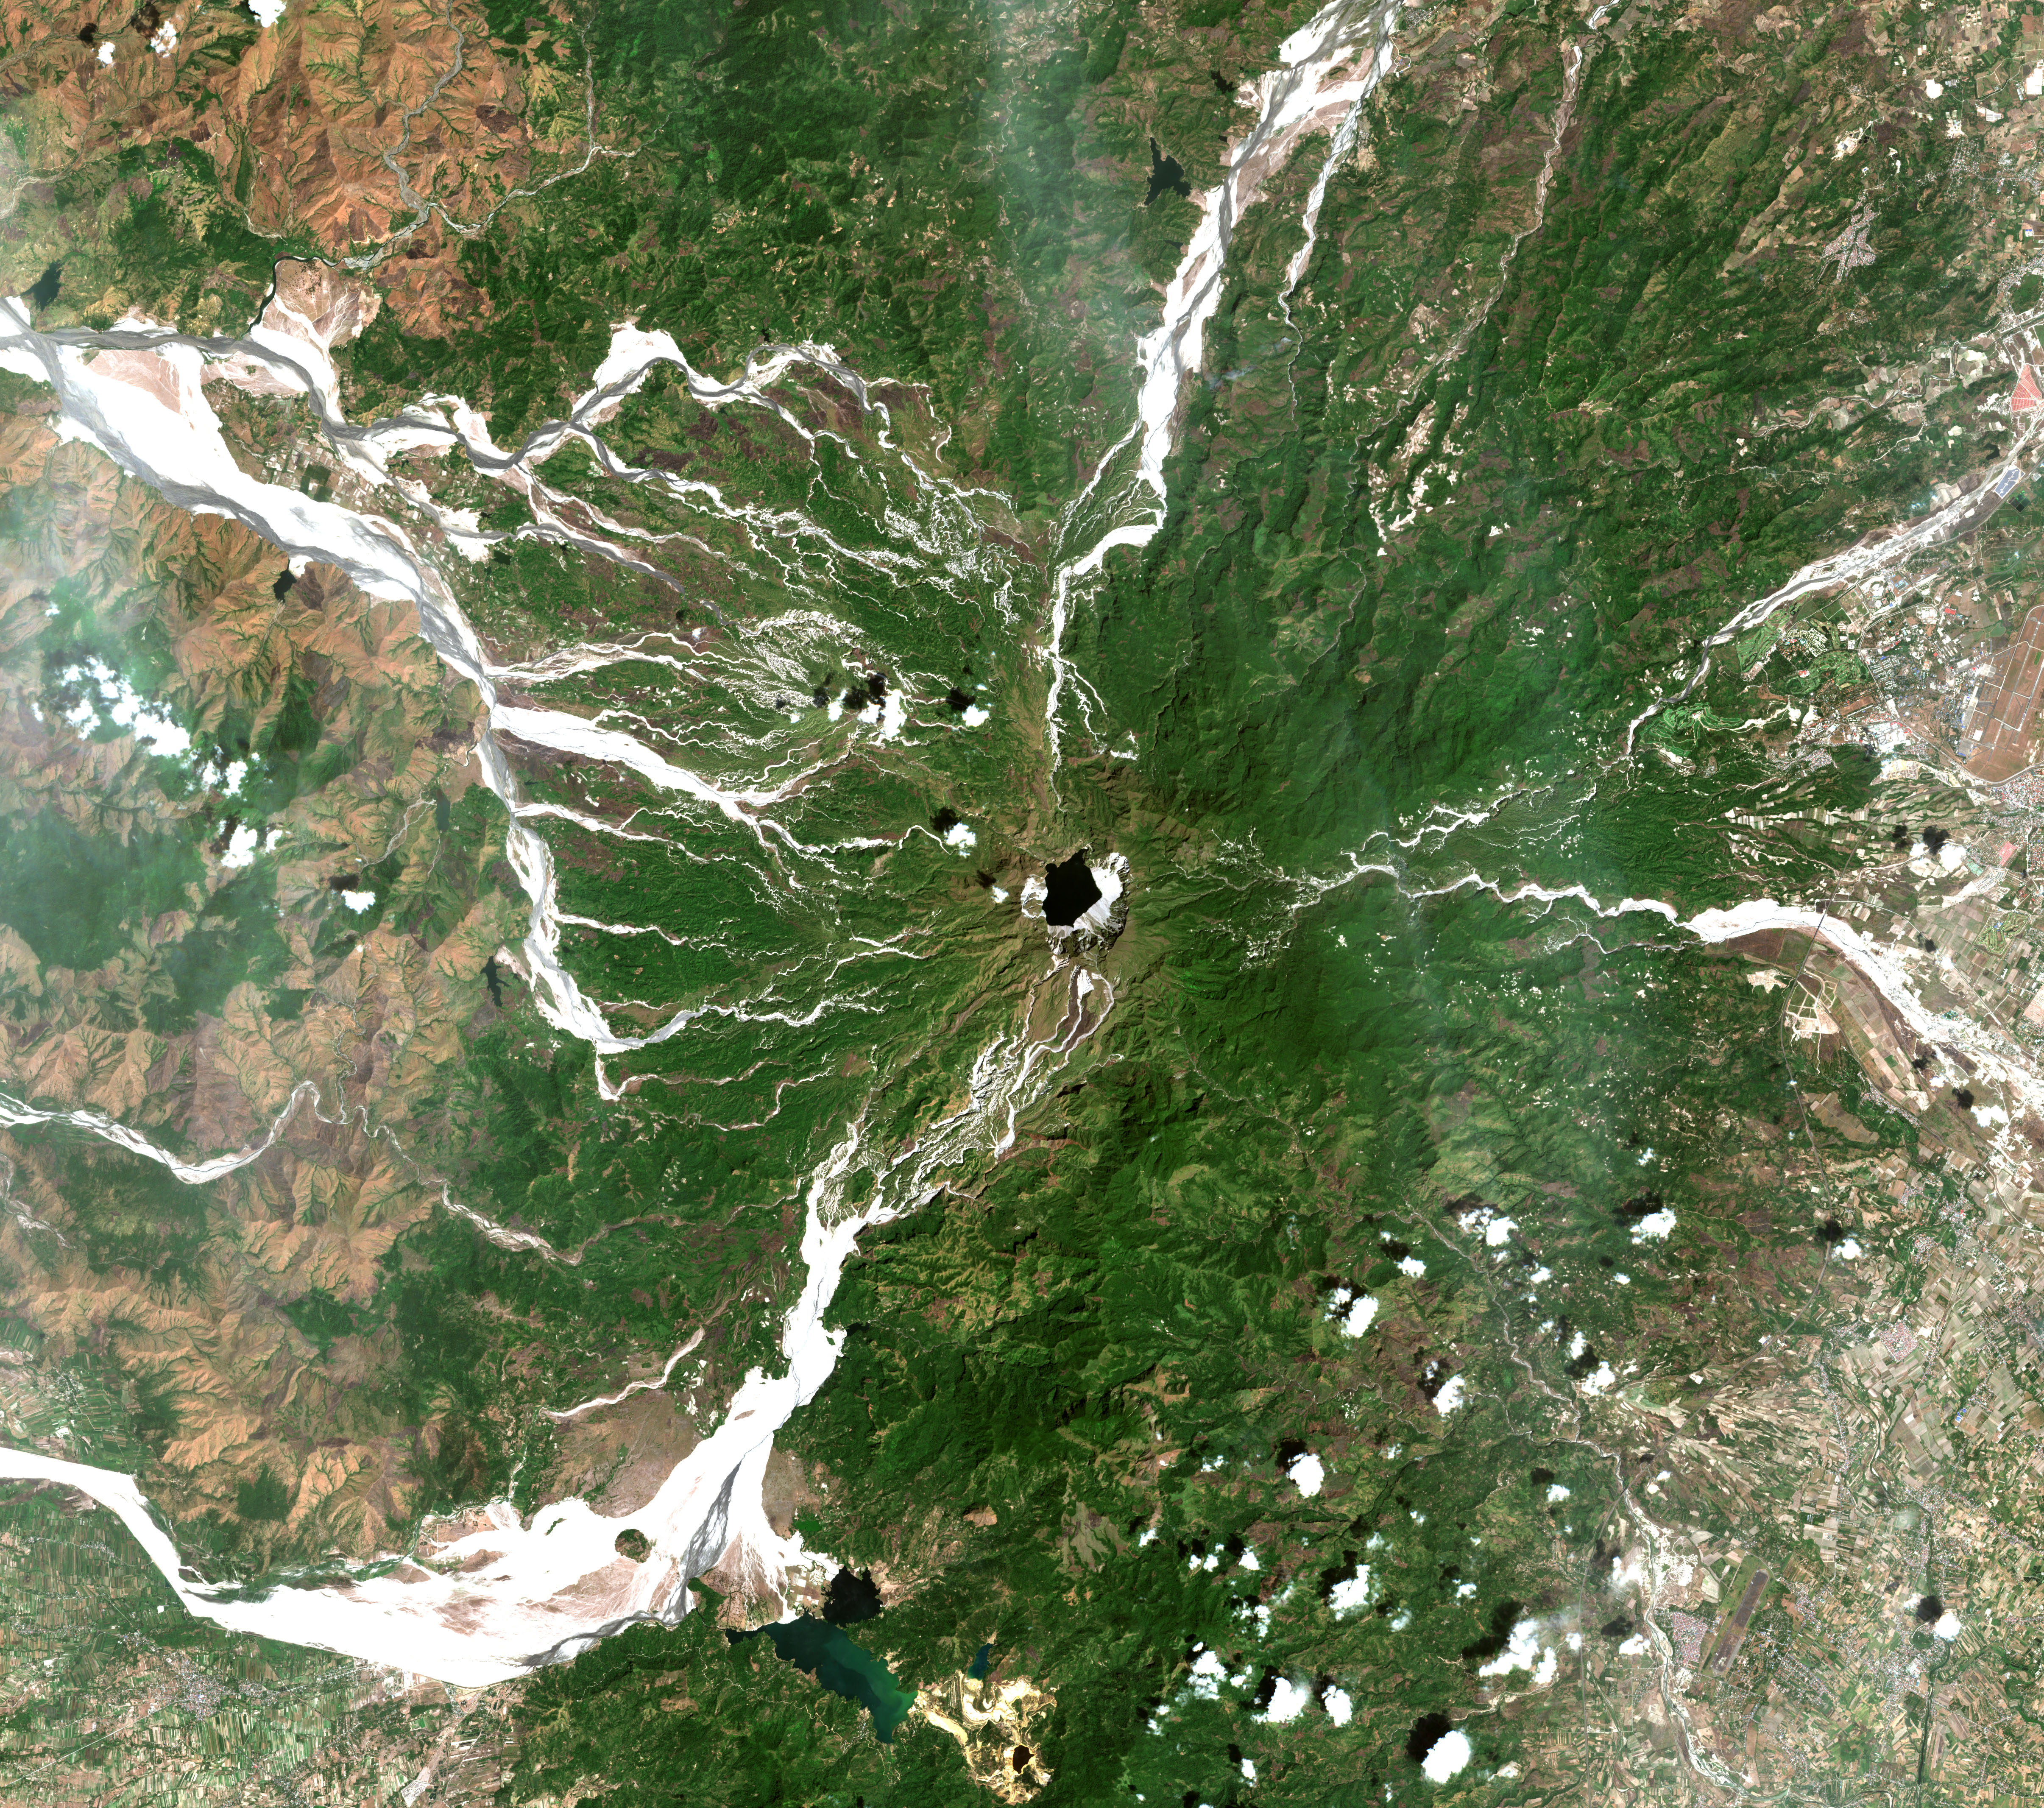
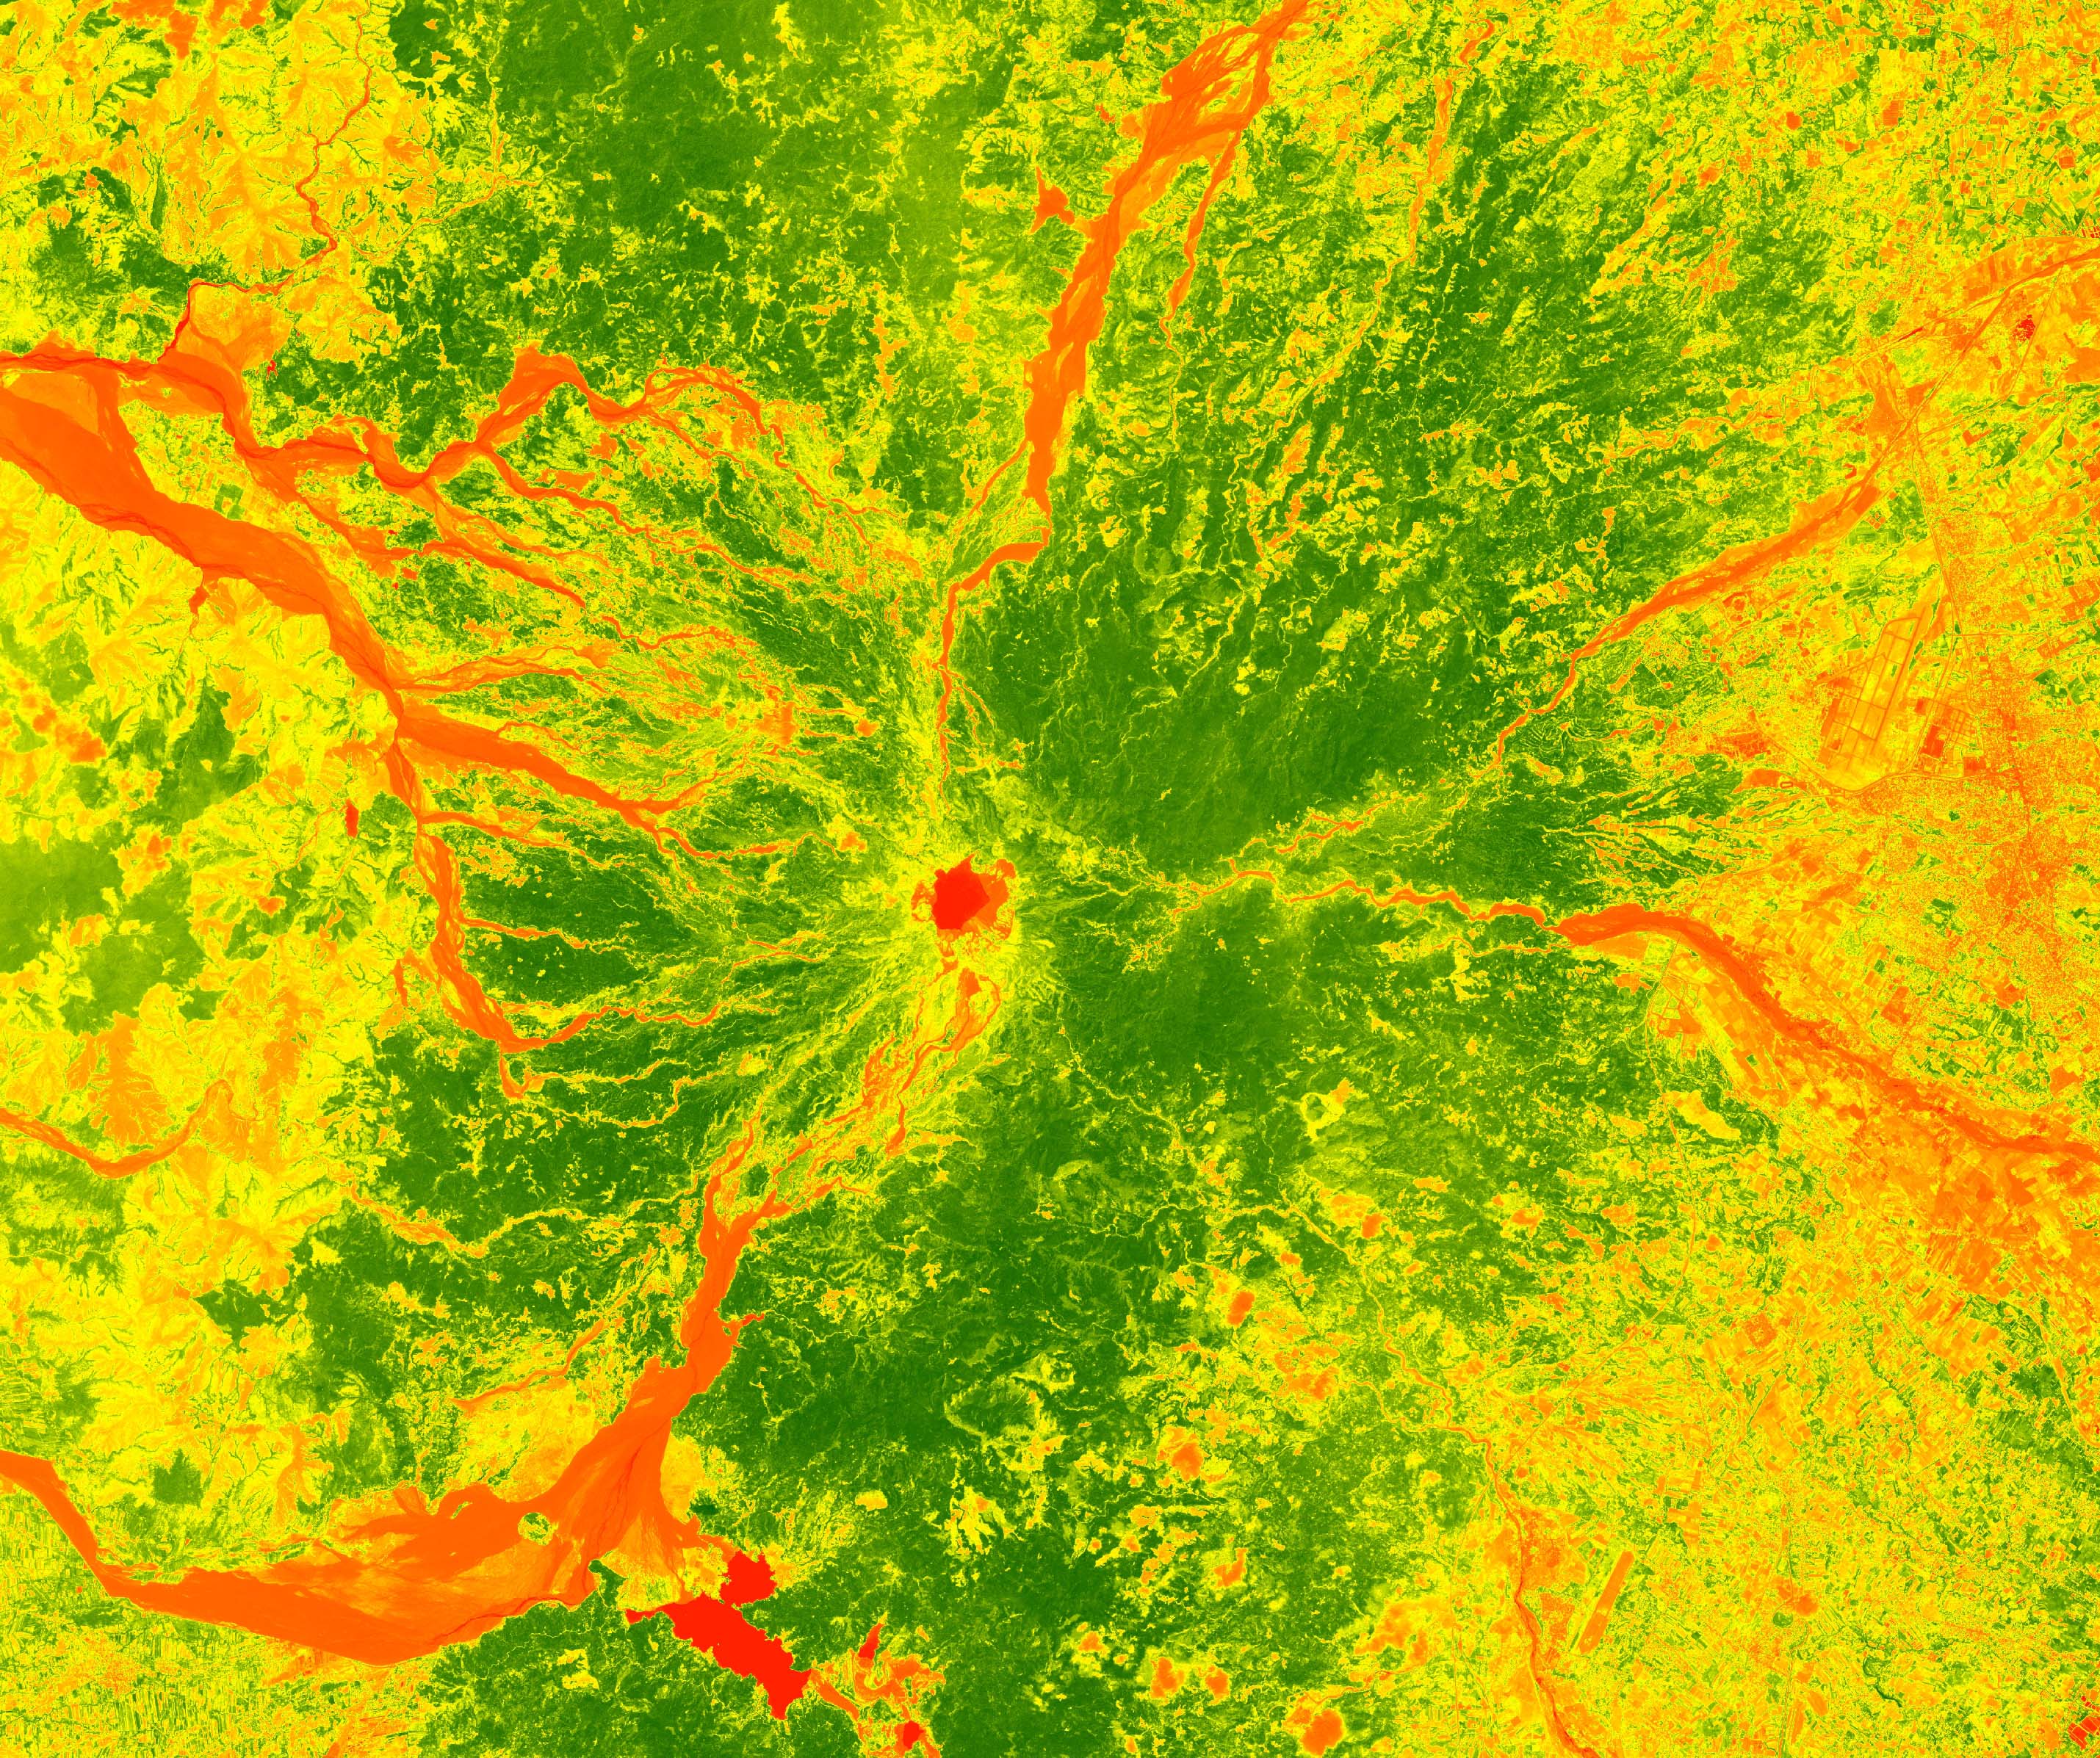
The European Space Agency has developed a suite of new satellites with radar and multi-spectral imaging instruments to monitor the Earth’s surface, oceans and atmosphere. Data from these satellites will bolster the earth observation record with free and open access data. I am particularly interested in the Sentinel-2 mission which will provide high-resolution multipsectral data for numerous land monitoring applications with a five day revisit time. Sentinel-2A was launched in June 2015; Sentinel-2B is slated for a late 2016 launch. I thought I’d have a look at a new Sentinel-2A image that captured Mount Pinatubo because earlier this month marked 25 years since the massive volcanic eruption on the island of Luzon in the Philippines. It was the second largest terrestrial eruption of the 20th century and its effects were felt on a global scale. As you might imagine, the local landscape changed dramatically along with the livelihoods of people in the Pinatubo area.


I acquired a Sentinel-2A image from the USGS EarthExplorer archive. The data are delivered in JP2 file format, which unfortunately is not supported in R. There are a number of conversion methods outside of R, but I decided to have a look at the Sentinel-2 Toolbox developed by the European Space Agency. The toolbox is open source and includes a number of data visualization, analysis and processing tools for Sentinel-2 data and a number of other satellite platforms (e.g. Landsat, MODIS, SPOT, etc.). The following images were created using the Sentinel-2 toolbox:


The Sentinel-2 satellites measure reflected radiance through the atmosphere with 13 spectral bands at various spatial resolutions:
- 4 bands at 10 meter: blue (490 nm), green (560 nm), red (665 nm), and near-infrared (842 nm).
- 6 bands at 20 meter: 4 narrow bands for vegetation characterization (705 nm, 740 nm, 783 nm, and 865 nm) and 2 larger SWIR bands (1,610 nm and 2,190 nm) for applications such as snow/ice/cloud detection or vegetation moisture stress assessment.
- 3 bands at 60 meter: mainly for cloud screening and atmospheric corrections (443 nm for aerosols, 945 nm for water vapor, and 1375 nm for cirrus detection).
Top image: Manila Bay, Philippines captured by the Sentinel-2A satellite
