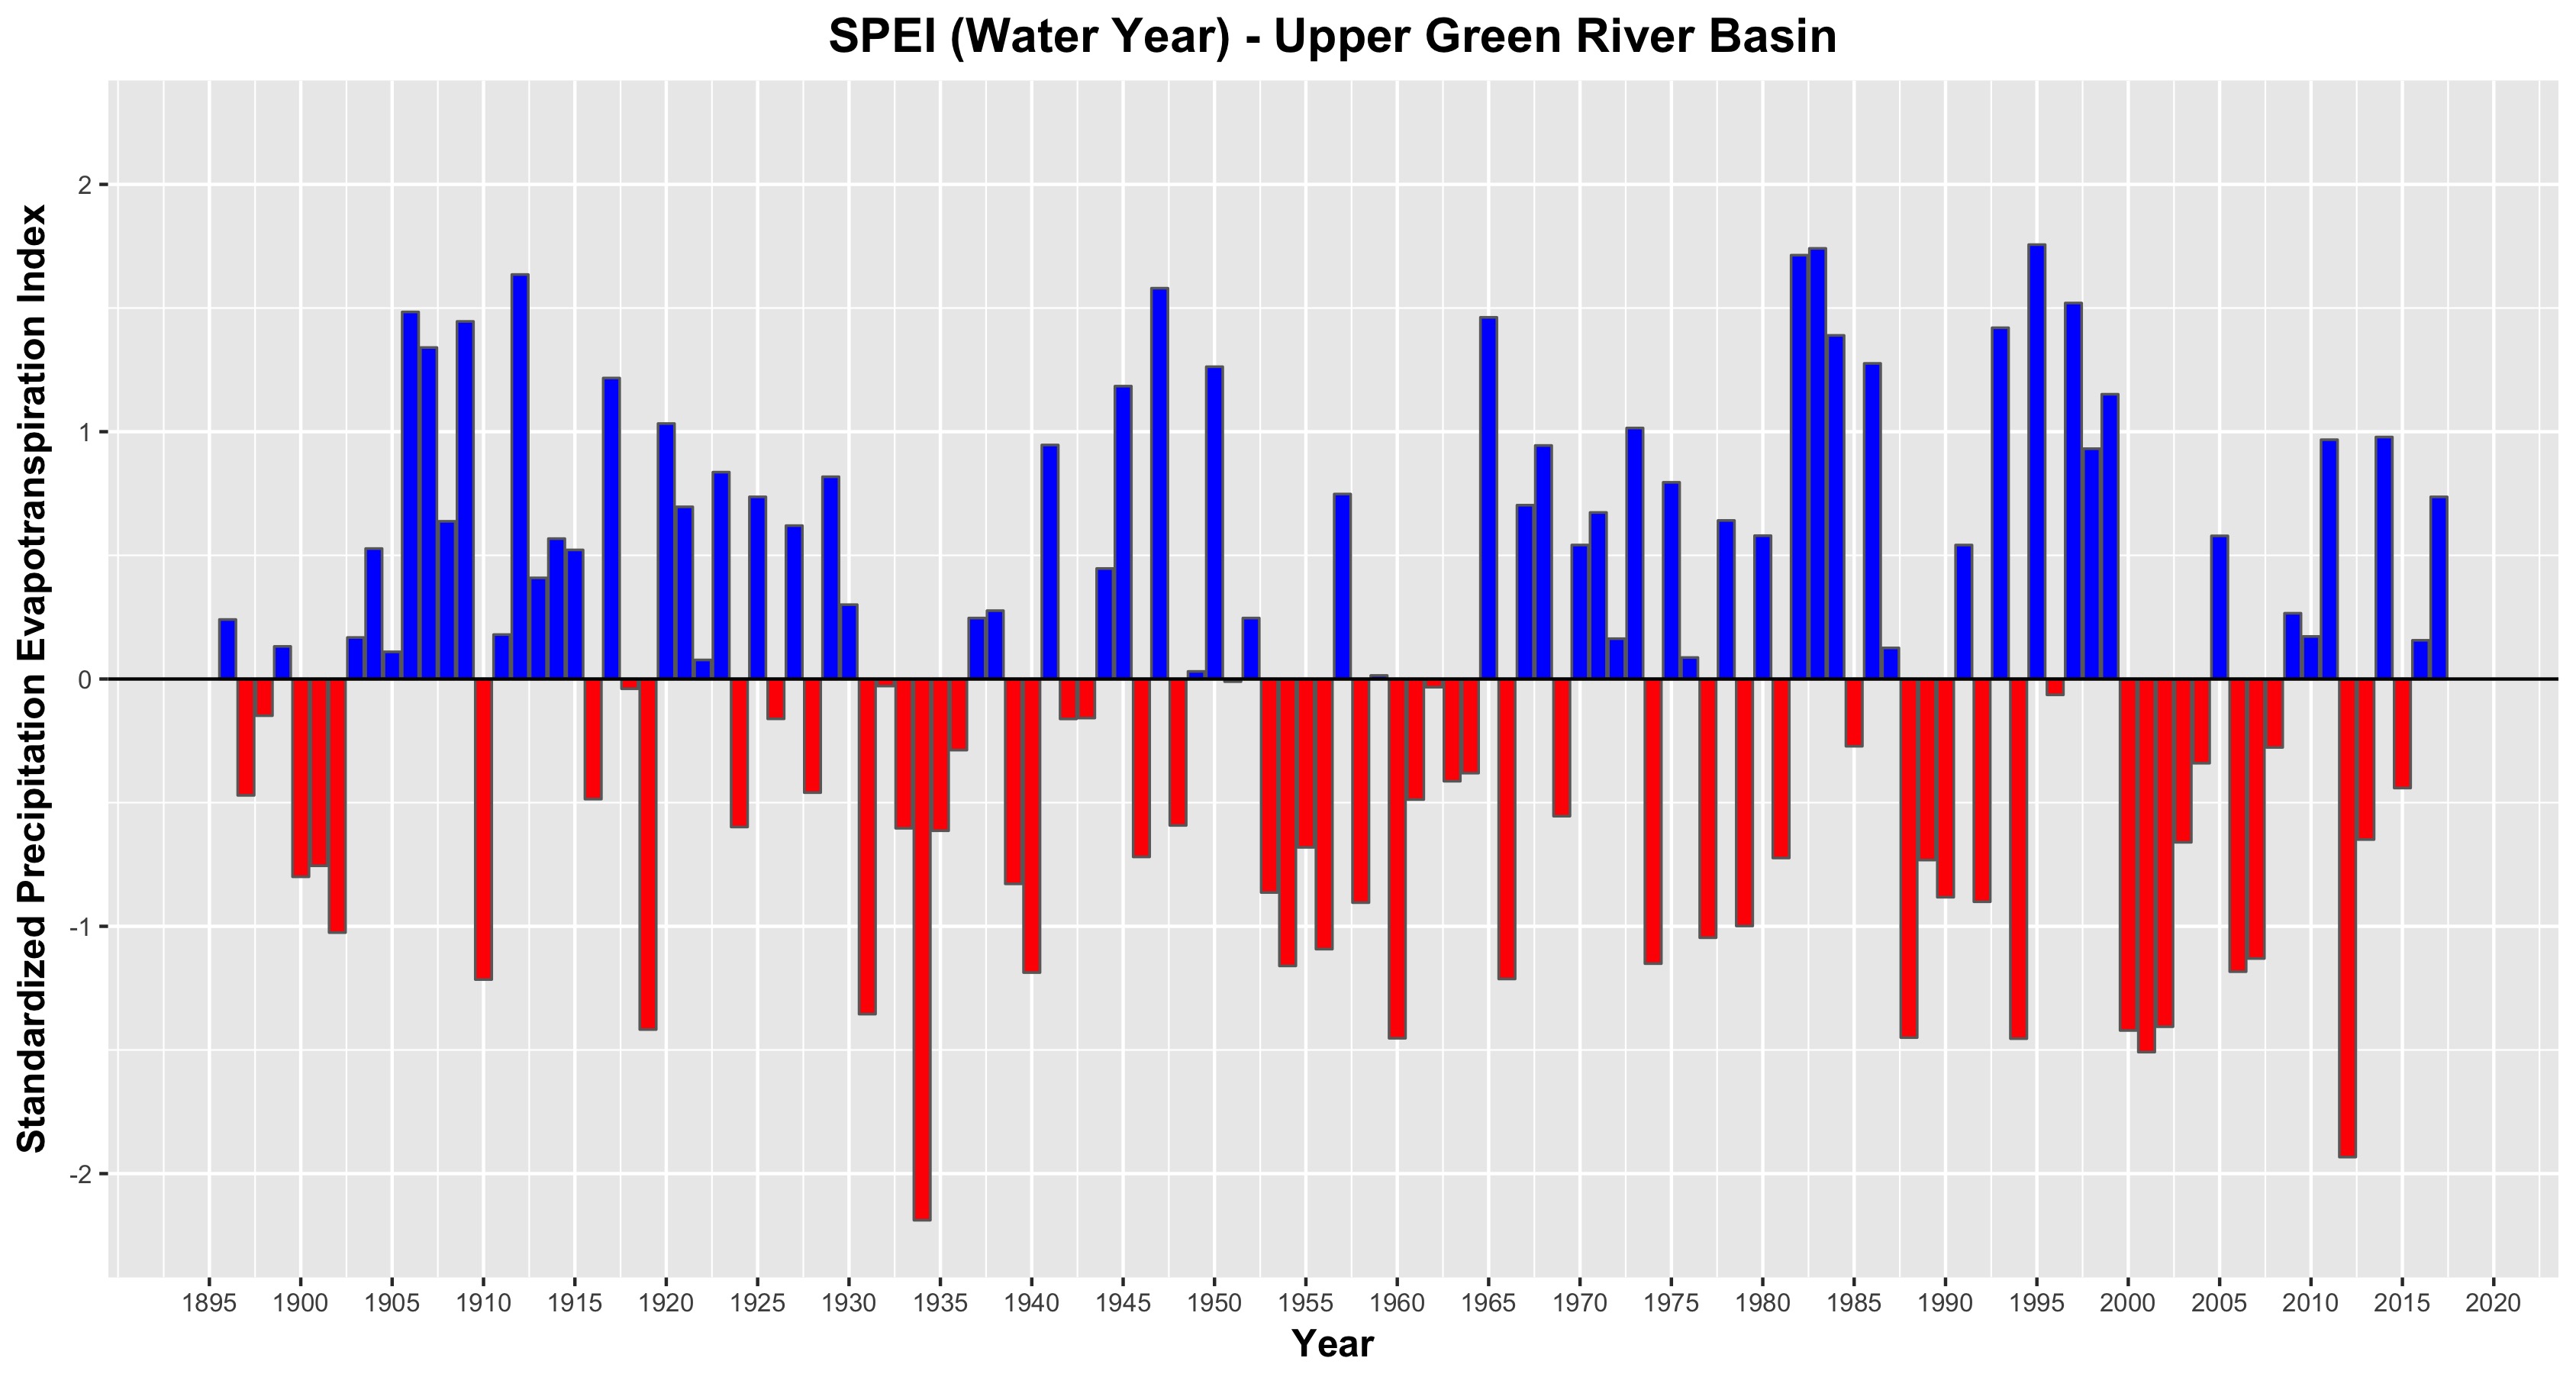
We recently published a new data which summarizes the standardized precipitation evapotranspiration index (SPEI) for the Upper Green River Basin (Wyoming) to quantify climate variability over the last century. The data set is a simple data visualization tool and a citable product for our Wyoming Landscape Conservation Initiative partners. It is also part of our ongoing research on drought in the sagebrush ecosystem. The SPEI considers the difference between precipitation and potential evapotranspiration to calculate a climatic water balance at a given time scale. The number of standard deviations the climatic water balance deviates from the long-term mean for a given time period represents the SPEI for the time period. Here, I calculated the SPEI for each water year (Oct–Sept) between 1896 and 2017. The SPEI score is shown on the y-axis and time on the x-axis. Years in red indicate a lower SPEI than the long-term mean, whereas years in blue indicate a higher SPEI than the long-term mean. Data were obtained from the Western Regional Climate Center.
Assal, T.J., 2018, Standardized Precipitation Evaporation Index for the Upper Green River Basin (1896-2017): U.S. Geological Survey data release, https://doi.org/10.5066/P9VLM7Z6.
Top image: dry soil photographed in the Little Colorado Desert, Sweetwater County, Wyoming