The coronavirus has gripped the world the last few weeks. Many things are uncertain, anxiety is running high and academia has transitioned to remote course offerings. We as a society owe a huge debt of gratitude to our first responders, healthcare workers, scientists, researchers, food producers, restaurateurs, grocery clerks ….. and all of those I forgot.
There have been a number of social media clips depicting the reduction in emissions due to the slowdown of the global economy using satellite data. Notably from NASA’s Earth Observatory:
Nitrogen dioxide over #China has dropped with the coronavirus quarantine, Chinese New Year, and a related economic slowdown. https://t.co/URfLNy0GZJ #NASA #COVID2019 pic.twitter.com/PM60uL772K
— NASA Earth (@NASAEarth) March 4, 2020
Italy has been extremely hard hit during this pandemic and the entire country was put on lockdown on March 9th. Cat Clifford and Denise Chow each wrote brief articles last week detailing the increased clarity in the Venetian canal’s due to the coronavirus slowdown.
A ripple effect of the coronavirus lockdown provides a bit of reprieve for Venice. I imagine if that City were a woman, She's stretching her aching back, tired from the constant parade of tourist plodding. https://t.co/Xq6R9zp8YR
— Catherine Clifford (@CatClifford) March 18, 2020
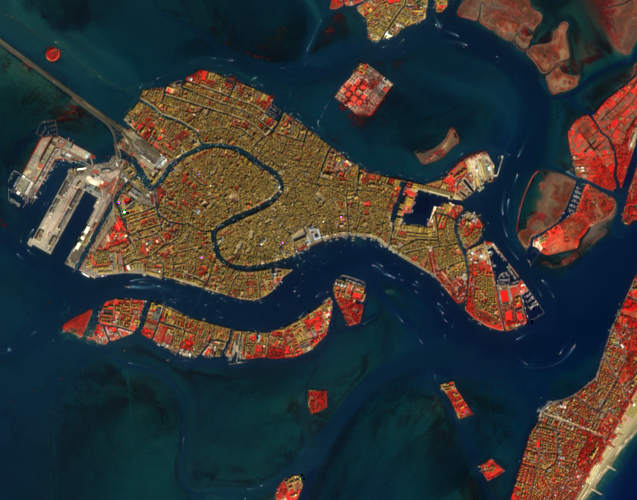
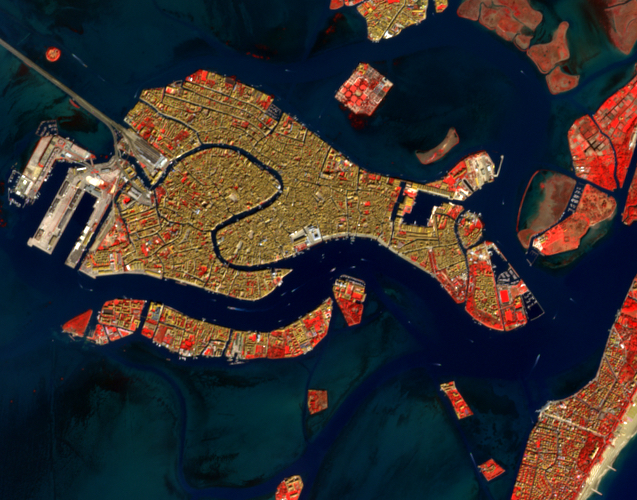
I was pretty sure the Google Earth Engine archive would not have any imagery with the spatial detail to detect changes in the clarity of the canals (maybe the Grand Canal?). I decided to have a look though, as it would make a nice segue for my change detection lecture in my remote sensing course this week. The 10-m spatial resolution of Sentinel-2 imagery is not adequate to detect changes in suspended sediment in any of the canals, but the lack of boat traffic around the island compared to this time last year is quite noticeable! Below are two false-color composite images – one from last March and one from last week – for visual comparison.
The Venetian Lagoon March 15, 2019:
The Venetian Lagoon March 16, 2020:
For more information on Google Earth Engine, see my previous posts here and here. See below for the code used in Google Earth Engine to generate the images:
//pull down specific granule, add layer and set display parameters
var s2a= ee.Image('COPERNICUS/S2_SR/20190315T101021_20190315T101043_T32TQR');
Map.addLayer(s2a, {bands: ['B8', 'B4', 'B3'], max: 4000}, 'S2_15March2019')

var s2b= ee.Image('COPERNICUS/S2_SR/20200316T100021_20200316T100023_T32TQR');
Map.addLayer(s2b, {bands: ['B8', 'B4', 'B3'], max: 4000}, 'S2_16March2020')

// Center map on Venice, Italy
Map.setCenter(12.33, 45.43, 13);
Top image: The Grand Canal (left) and Piazza San Marco (right) viewed from San Giorgio Maggiore during busier times (circa 2007), Venice, Italy.